Hey, remember these? Analytical posts where we learn things about how IndyCar works? What happened to those? It’s been like 6 months.
Ok well a few reasons for that: One: I have a toddler who learned to walk so my life is over. Two: it was the regular season and I was busy watching IndyCar racing. Three: and this is the real excuse here because I’m an OK dad at best and IndyCar races average like 1 hour per week of my time - I basically spent the whole summer building the stats page.
One of the fun things I discovered about building out our stats page is you get to make up whatever stats you want. One of the less fun things about building out our stats page is the readers’ expectation that these stats actually mean something.
Typically, the easiest way to decide whether a stat is good is to just go with whatever supports your current argument. Want to argue that Pato O’Ward had a better 2025 than Kyle Kirkwood? Well he did have a better average Starting Position and Finishing Position, and he had twice as many Laps Led as Kirkwood. Want to argue Kirkwood is better? Just go ahead and sort by the Wins column. If you’re an O’Ward fan, obviously FP, SP and LL are much more indicative of success than just wins. If you’re a Kirkwood fan, it’s all about the W’s baby!
But if you want to be more objective about which metrics you use - probably because you’re a nerd - it’s helpful to know what metrics are repeatable. Or put another way, which metrics are most closely tied to underlying driver and team skill and therefore should be expected to remain more consistent from race to race and season to season.
For example: points may fluctuate a lot in a sport where someone else’s tiny mistake can send you from first to last, but maybe there are other metrics that are more useful in answering the question “Who is going to score a lot of points going forward?”
Running Position
All of these considerations led me to calculate running position metrics. The idea of running position is to look at performance across the entirety of a race - not just the last lap.
So what are these new running position metrics?
Average Running Position (ARP): This is a pure mathematical average of an entry’s running position across all laps that entry ran.
Track-Equalized Average Running Position (eqARP): Like other track-equalized metrics, this normalizes the different lap counts across different races before taking the average. i.e. if an entry ran in first for all 250 laps at Gateway and ran in 25th for all 55 laps at Road America, then eqARP would be 13 (halfway between 1 and 25) while ARP would be 5.3 for these 2 races (which probably makes you think the driver ran in the top 10 for both races).
Running position metrics only consider laps actually run (hence “running”) so DNF effects are removed. This means drivers who have a lot of DNFs are going to look much better by running position than by finishing position.
The real question is why bother?1 Obviously a team’s goal is to maximize their running position on the last lap, not to maximize their running position across the entire race. Why do we care what happens between lap one and lap one to go?
Well, having never driven an IndyCar myself, I’d imagine it’s kind of hard to run middle of the pack for the entire race then to make your way up to the top in the final lap. It seems like maybe your life would be easier if you spent the race trying to put yourself in the best position possible. In fact, I’m willing to offer a theory that the drivers who do that consistently are more likely to finish towards the top than the drivers who don’t.
Correlation Between Metrics
So how do we test this wild theory? Well the easiest test is to simply look at the correlation between metrics. Two metrics with a higher correlation will be more closely related to each other than metrics with a low correlation. The plots below show the correlation between metrics - breaking drivers into individual seasons and only looking at drivers who drove at least 12 races for the same team in a season.
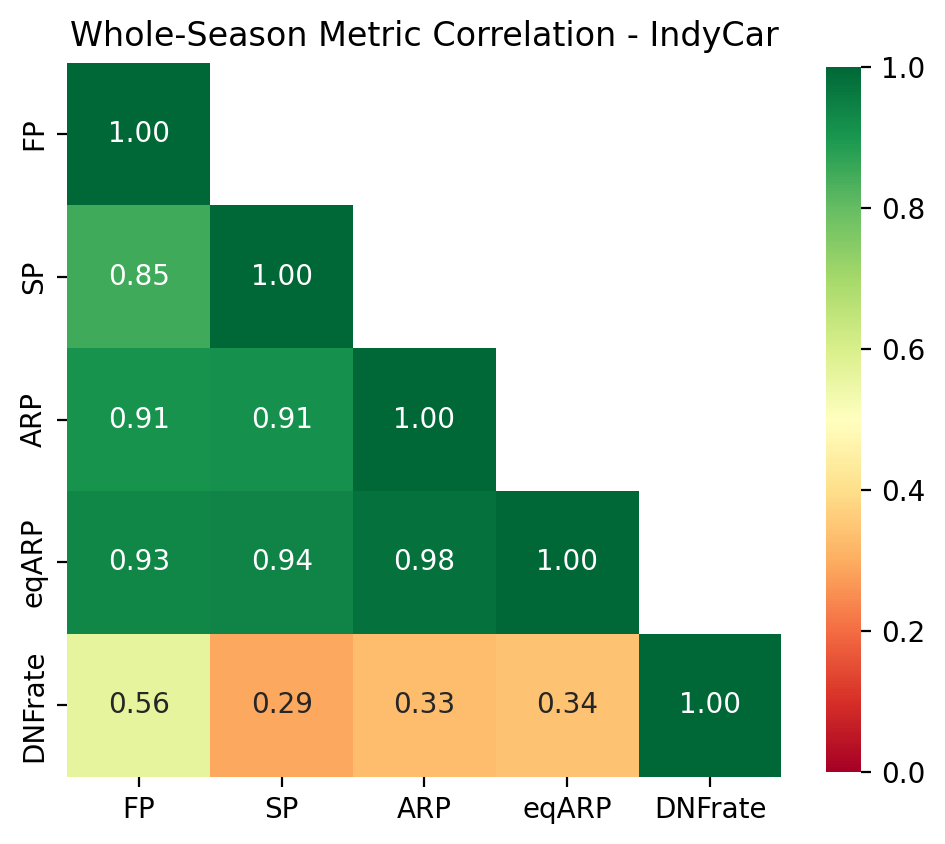
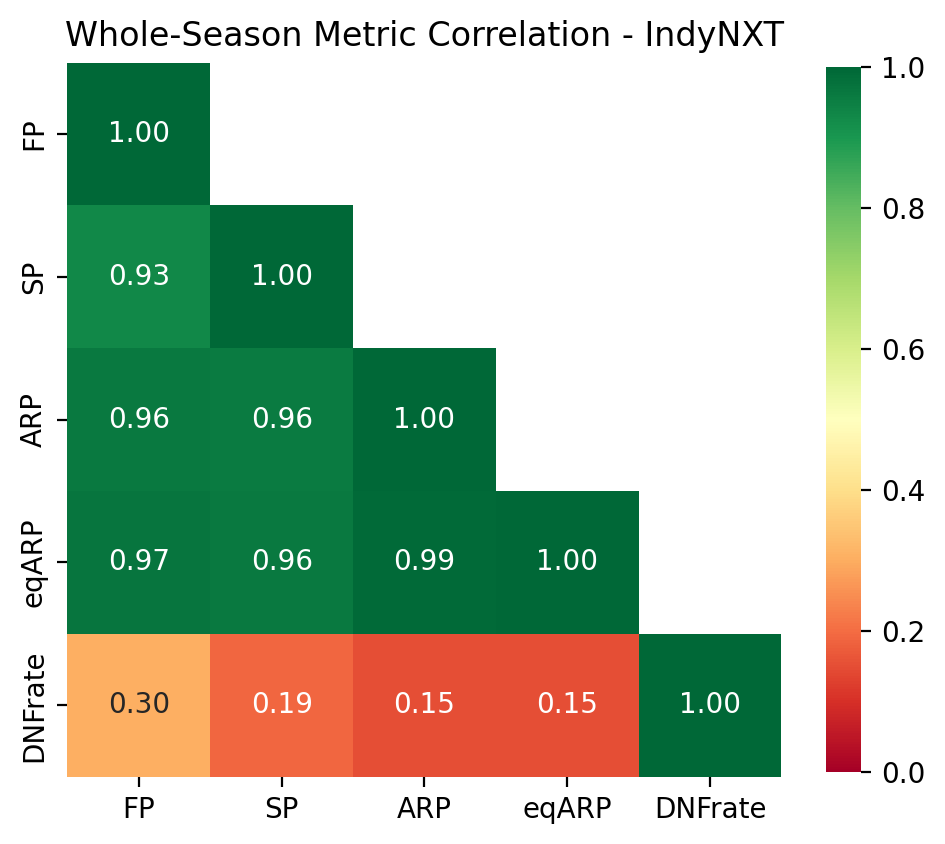
Unsurprisingly ARP and eqARP are pretty closely tied to FP, and about equally close to SP. In fact, every metric here seems to be reasonably correlated, except DNFRate which was not invited to the party. None of this comes as a surprise but it is good confirmation that things work the way we expect them to.
What Metrics Are Repeatable?
But this doesn’t answer our original question. We want to know whether ARP and eqARP capture driver and team skill more closely than other metrics - especially Finishing Position.
To answer this question we need to introduce some element of time - i.e. we need to be able to see if a metric stays consistent as time passes. There are a million different ways we can do this, but today let’s just keep it simple and break driver seasons into first half and second half. Any driver season with at least 12 races is included. Now instead of correlating these metrics to themselves, we correlate 1st half metrics to 2nd half metrics. The results are below with first half representing the rows and 2nd half representing the columns.
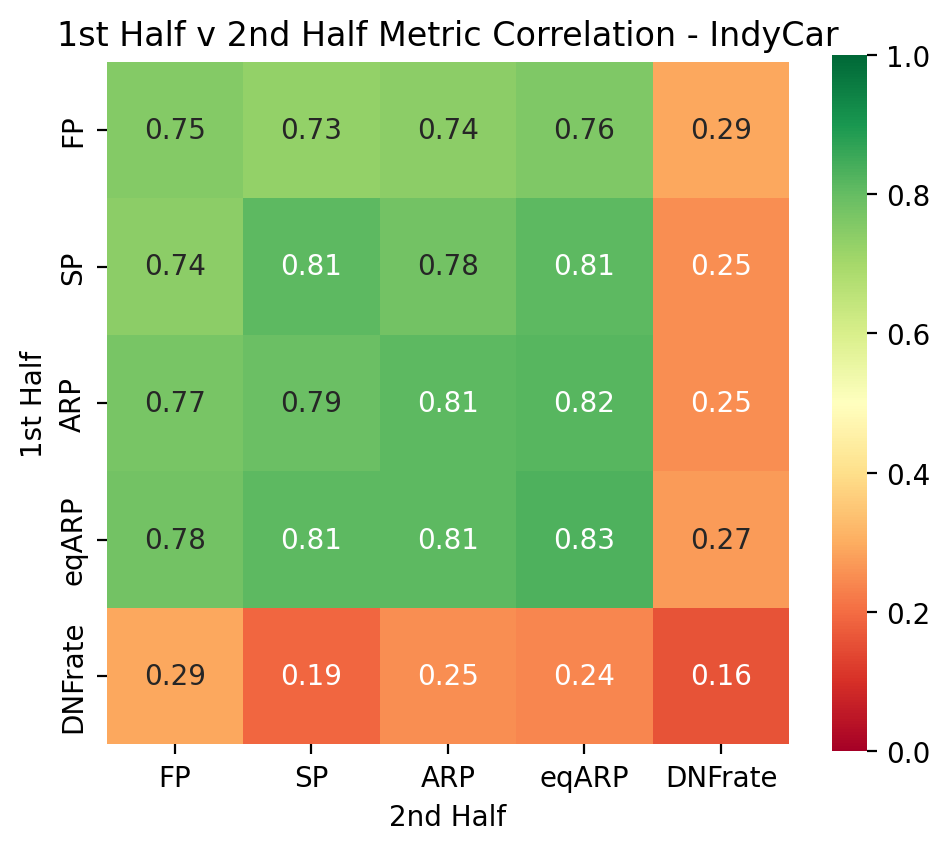
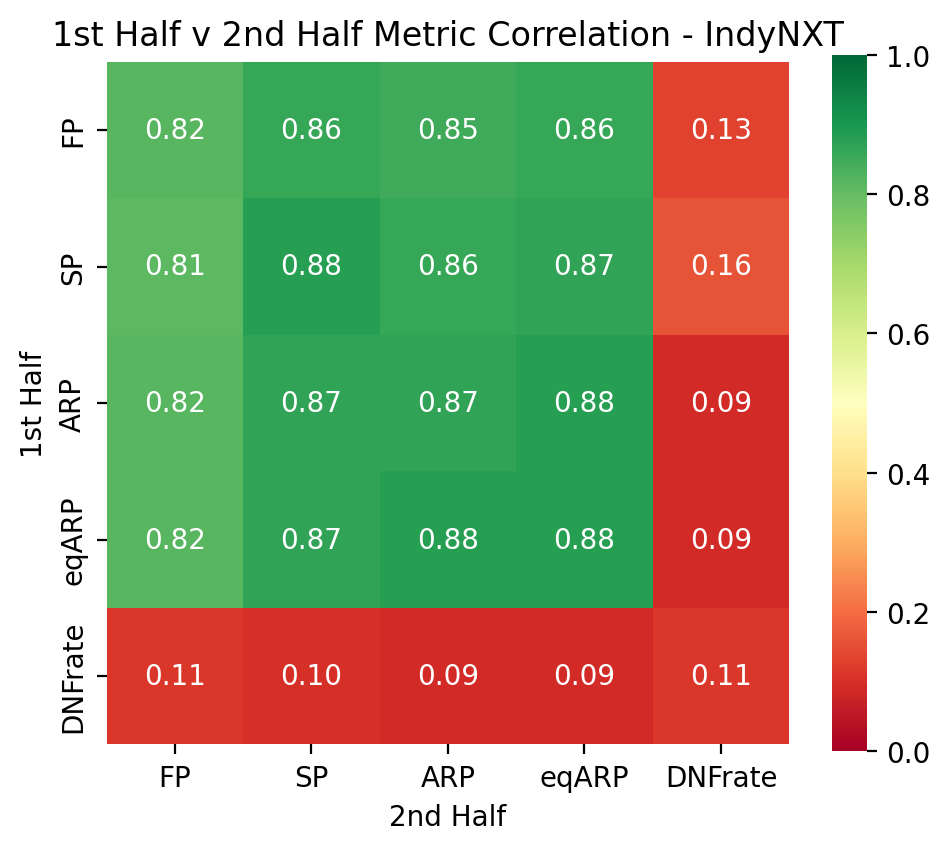
The first thing we want to look at is the diagonal. This tells us how well each metric correlates to itself from 1st half to 2nd half. The numbers look like this:
| IndyCar | IndyNXT | |
|---|---|---|
| FP | 0.75 | 0.82 |
| SP | 0.81 | 0.88 |
| ARP | 0.81 | 0.87 |
| eqARP | 0.83 | 0.88 |
| DNFRate | 0.16 | 0.11 |
It’s reassuring to see that ARP and eqARP are both very highly correlated from 1st half to 2nd half, along with SP. This helps confirm our suspicion that these three metrics are representative of driver/team skill.
On the other hand, 1st-half DNFRate has very little correlation to 2nd-half DNFRate. We already saw that DNFRate does not correlate much with other metrics, so this shouldn’t come as too much of a surprise that it doesn’t correlate with its future self either.
With that in mind, I do want to say something here that may be obvious but is really important to understanding IndyCar: DNFs are mostly a product of bad luck and recent DNFs do not typically indicate more DNFs are to come. This matters because DNFs affect Finishing Position which affects Points which affects standings, and we DO judge drivers on standings.
It’s not unfair to judge drivers and teams on standings, but we need to understand the difference between on-track results and the inputs to those results that drivers and teams can control. SP, ARP, eqARP are much more driven by repeatable skill than DNFs. So if we see a driver that is qualifying well and averaging a high running position in their races, but has a lot of DNFs, then it’s fair to conclude that entry is performing well but is just getting “unlucky” with DNFs.
Unlucky is of course a subjective word here; those DNFs may well be the driver’s fault. But these numbers tell us that if a driver has a strong weekend and makes a single mistake that results in a DNF, then that strong weekend is more likely to persist into the future than the small mistake that led to the DNF.
What Drives Future Success?
There’s a lot more here to explore than just the diagonal, however. Understanding how first half metrics correlate to other metrics in the 2nd half is useful when we’re trying to answer questions like “who will be good going forward?”. For instance, metrics that correlate more highly to 2nd-half FP are useful in telling us which repeatable driver skills actually lead to future success.
Here’s what that looks like. The below table shows how each 1st-half metric correlates to 2nd-half Finishing Position, broken down by series:
| IndyCar | IndyNXT | |
|---|---|---|
| FP | 0.75 | 0.82 |
| SP | 0.74 | 0.81 |
| ARP | 0.77 | 0.82 |
| eqARP | 0.78 | 0.82 |
| DNFRate | 0.29 | 0.11 |
OK now we’re cooking. The goal is to get the best FP possible right? Well if you’re looking at 1st-half stats and you want to know who is going to have the best 2nd-half FP, ARP and eqARP are actually more predictive of future FP than either FP or SP2. This makes sense because DNFs affect FP but not ARP and eqARP. We know DNFs are very noisy, so it’s no surprise the stats that are highly correlated to FP but have less-noisy inputs are the ones that end up being more predictive of future FP.
I also want to quickly shout out the win for track-equalized metrics here. eqARP slightly beats ARP when it comes to predicting future success. I’ve created a number of track-equalized stats and put them on the stats page, so it’s nice to get the little bit of validation that (as we’d expect) equal-weighting races is a little more predictive than just using raw laps (which over-weights ovals).
Track Types3
Our next question - because this is IndyCar - how do track types affect these numbers?
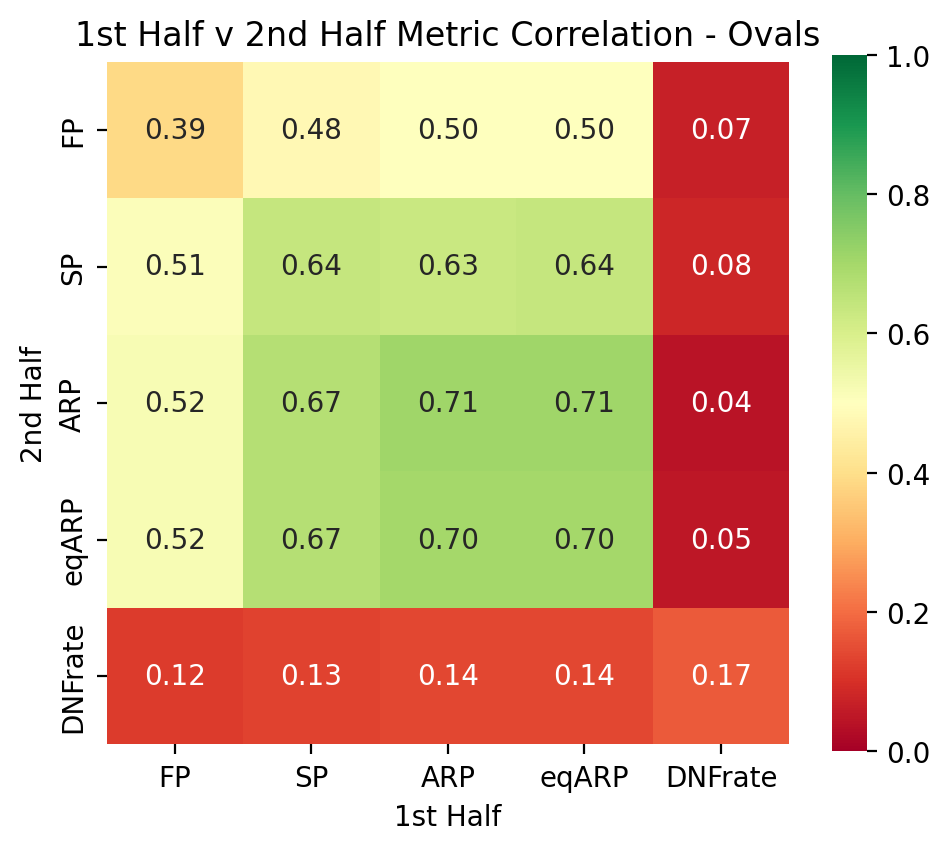
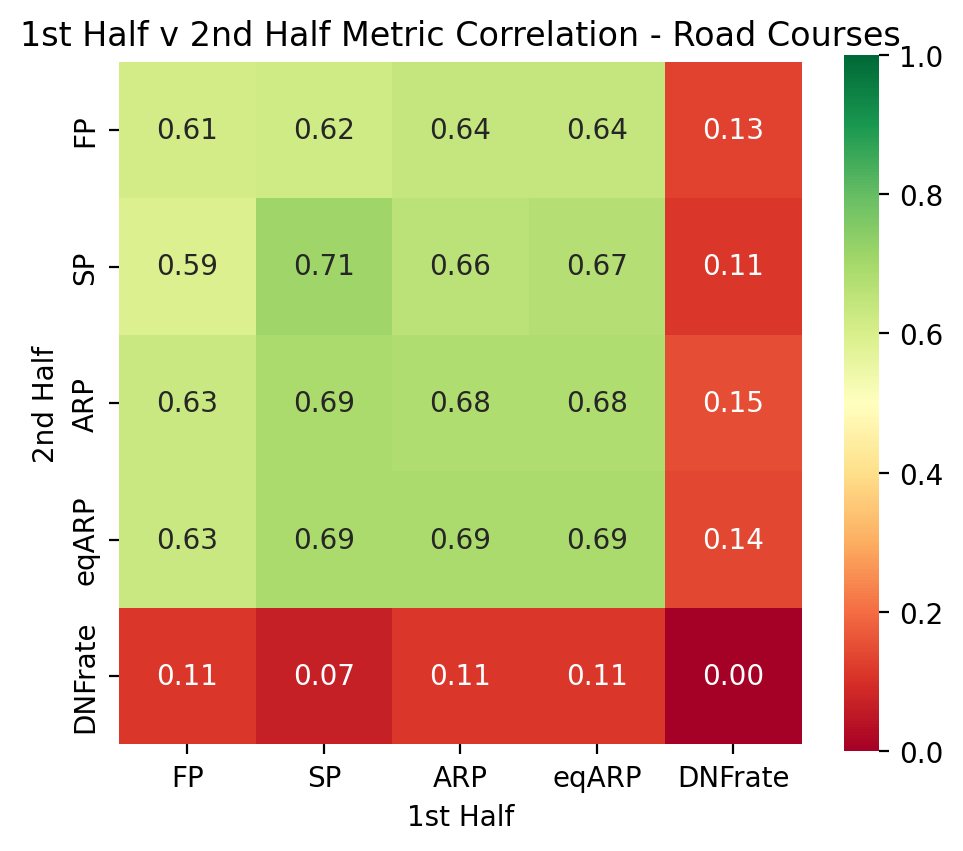
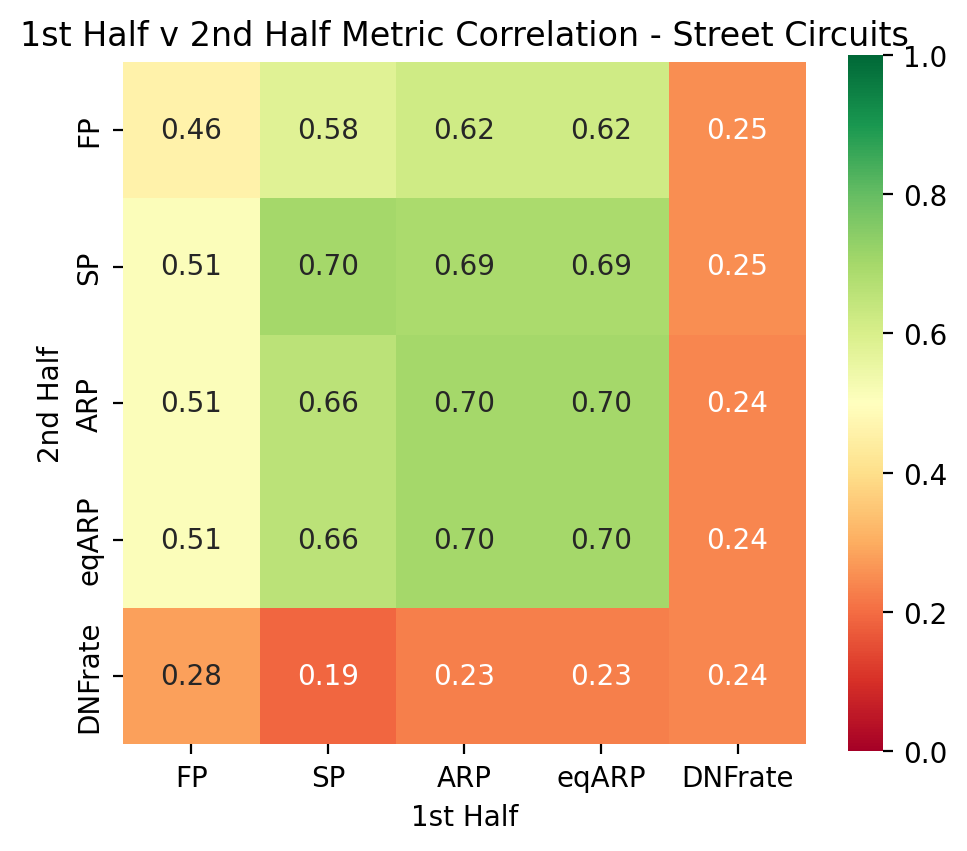
The correlations are lower across the board, but this is more a product of having to use smaller sample sizes (only 2-3 races per half). What’s important is the differences - both across a track type and between different track types.
Ovals show really low correlation between 1st half and 2nd half FP - how you finish on an oval does not have an awful lot to do with how you’re going to finish on an oval in the future4. The same can be said of street circuits, but less so. At all 3 track types, ARP and eqARP are more predictive of future FP than any other metric and DNF rate has low correlation across the board - but much higher correlation to itself and other metrics at street circuits than road courses or ovals.
This looks like yet another DNF story. Ovals - as we know - have a higher DNF rate than any other track type and street courses have a higher DNF rate than road courses. To repeat: DNFs are largely luck-driven, but they have a major impact on FP. So it makes sense that the track types with higher DNF rates in general have low correlation between 1st half and 2nd-half FP.
And what about DNFRate in street races? Why is that more highly correlated to future DNFRate in street races? Well the correlation is still low - so the key takeaway is still mostly luck, but it does appear a little more skill goes into finishing on a street circuit than a road or oval.
How About We Name Some Guys
OK, so at this point we’ve shown that ARP is highly predictive of future finishing position. But just for fun, let’s look at some of the biggest discrepancies between ARP and FP in a single season. RP metrics start in 2013 so that’s how far back we’ll look, and we’ll limit it to entries that ran at least 12 races in the same car to eliminate part-time drivers.
Here are the driver seasons that most underperformed their ARP:
| Driver | Season | R | ARP | FP | Diff | DNFs |
|---|---|---|---|---|---|---|
| Josef Newgarden | 2025 | 17 | 7.8 | 14.8 | -7.1 | 5 |
| Christian Rasmussen | 2026 | 18 | 12.9 | 17.8 | -4.9 | 7 |
| Colton Herta | 2019 | 17 | 8.4 | 13.2 | -4.8 | 6 |
| Josef Newgarden | 2024 | 17 | 8 | 12.8 | -4.8 | 3 |
| Conor Daly | 2025 | 17 | 10.9 | 15.3 | -4.4 | 1 |
| Tony Kanaan | 2013 | 15 | 8.1 | 12.5 | -4.4 | 4 |
| Pato O’Ward | 2022 | 17 | 6 | 10.3 | -4.3 | 3 |
| Ryan Hunter-Reay | 2013 | 15 | 6.6 | 10.9 | -4.3 | 5 |
| Felix Rosenqvist | 2023 | 17 | 10.2 | 14.5 | -4.2 | 5 |
| David Malukas | 2023 | 17 | 12.2 | 16.4 | -4.2 | 6 |
Man, Josef really had a bad 2025, talk about an outlier. The rest of the list mostly makes sense with a high number of DNFs5, but Conor Daly in 2025 also stands out with just 1 DNF while landing 5th on this list. Looking at his race logs, there isn’t much explanation other than he must have had a lot of races where he lost positions late.
Now let’s look at the opposite side of things - the drivers who outperformed their ARP over a whole season:
| Driver | Season | R | ARP | FP | Diff | DNFs |
|---|---|---|---|---|---|---|
| Christian Lundgaard | 2023 | 17 | 14.8 | 10.5 | 4.2 | 0 |
| Graham Rahal | 2020 | 13 | 12.3 | 8.7 | 3.6 | 1 |
| Christian Lundgaard | 2024 | 17 | 16 | 13 | 3 | 1 |
| Kyle Kirkwood | 2024 | 17 | 11.5 | 8.7 | 2.8 | 2 |
| Christian Lundgaard | 2026 | 18 | 9.8 | 7.2 | 2.7 | 0 |
| Kyffin Simpson | 2025 | 15 | 16.3 | 13.6 | 2.7 | 1 |
| Justin Wilson | 2013 | 15 | 11 | 8.4 | 2.6 | 1 |
| Christian Lundgaard | 2025 | 17 | 12 | 9.6 | 2.4 | 1 |
| Alex Palou | 2023 | 17 | 6.1 | 3.7 | 2.4 | 0 |
| Jack Hawksworth | 2014 | 17 | 15.4 | 13.1 | 2.3 | 1 |
You know how I said earlier that most drivers are trying to run top of the order for as much of the race as possible? I’m sure that’s also true of Lundgaard, but he does have a knack for gaining positions late in races - showing up on this list four times6. Lundgaard also seems to live in that small zone of correlation between DNFs and future DNFs, as he consistently finishes nearly every race every year. Honestly, he seems like a really good driver and the kind of guy a top-performing team would want to hang on to…
Conclusion
If there’s one thing I want you to take away today, it’s the thing I’ve said about 8 times now. Seriously, DNFs can have a serious impact on FP, but past DNFs do not indicate a higher likelihood of future DNFs. Therefore, when anticipating a driver’s future performance, you should use metrics that are highly predictive of future success and do NOT take DNFs into account like ARP and eqARP.
So if you want to use these newly-learned stats to make your IndyCar arguments in the future, I’d be flattered. But if you’d still rather just cherry-pick the stats that make your favorite drivers look good: go right ahead. All the stats you need are right there on the stats page.
And who knows, maybe someday you’ll want to use ARP and eqARP to cherry-pick your bad faith argument why Sting Ray Robb is better than Alex Palou. If that happens, I’ll be equally flattered.
Why bother is a hell of a question to ask when you spend your free time not just watching grown men drive in circles but reading or writing about stats related to those grown men driving in circles. That said please keep reading. Please! ↩︎
Or equally as predictive in IndyNXT. ↩︎
Yes a track types section is obligatory at this point. But the answer is always track types isn’t it? It’s like raising your hand in Sunday School and saying “Jesus” - you’re not gonna be wrong even if that wasn’t the actual question. ↩︎
This may explain why my predictive model was not a big fan of Josef Newgarden at the Indy 500 this year. ↩︎
Hopefully by now I’ve fully hammered the non-repeatability of DNFs into your head and you’re looking at Rasmussen’s 2026 thinking that he and ECR will probably be fine in 2027. If not, please reread this footnote 6 or 7 more times. ↩︎
If you’re thinking to yourself that Lundgaard’s overperformance is just a lap count story and he’s being inflated by performing better in the low-lap count races (i.e. road and street races): 1) Kudos for really getting it, nerd. 2) It’s actually a very similar table if I look at eqARP instead of ARP, so that actually doesn’t explain it. ↩︎